Beyond mNAV: What Really Drives Digital Asset Treasury Valuations?
This article draws on the original research paper, Exploring Digital Asset Treasury Valuations, authored by Roshan De Zoysa as part of the Industry Research component of the Digital Finance MBA - University of Sydney (UTS) and Digital Finance CRC. Edited by Nico Oefele (JellyC) and supervised by Ester Felez-Vinas (UTS).
Digital Asset Treasury companies appear relatively simple. A listed company raises capital, acquires digital assets such as Bitcoin or Ethereum, and gives investors equity-market exposure to those holdings. On that basis, you might expect companies holding similar assets to trade at broadly similar valuations. They do not.
In JellyC’s analysis of 12 pure-play publicly listed Digital Asset Treasury companies, market Net Asset Value, or mNAV, ranged from 0.17x to 1.76x. Some companies traded around or above the value of the digital assets on their balance sheets, while others traded at substantial discounts.
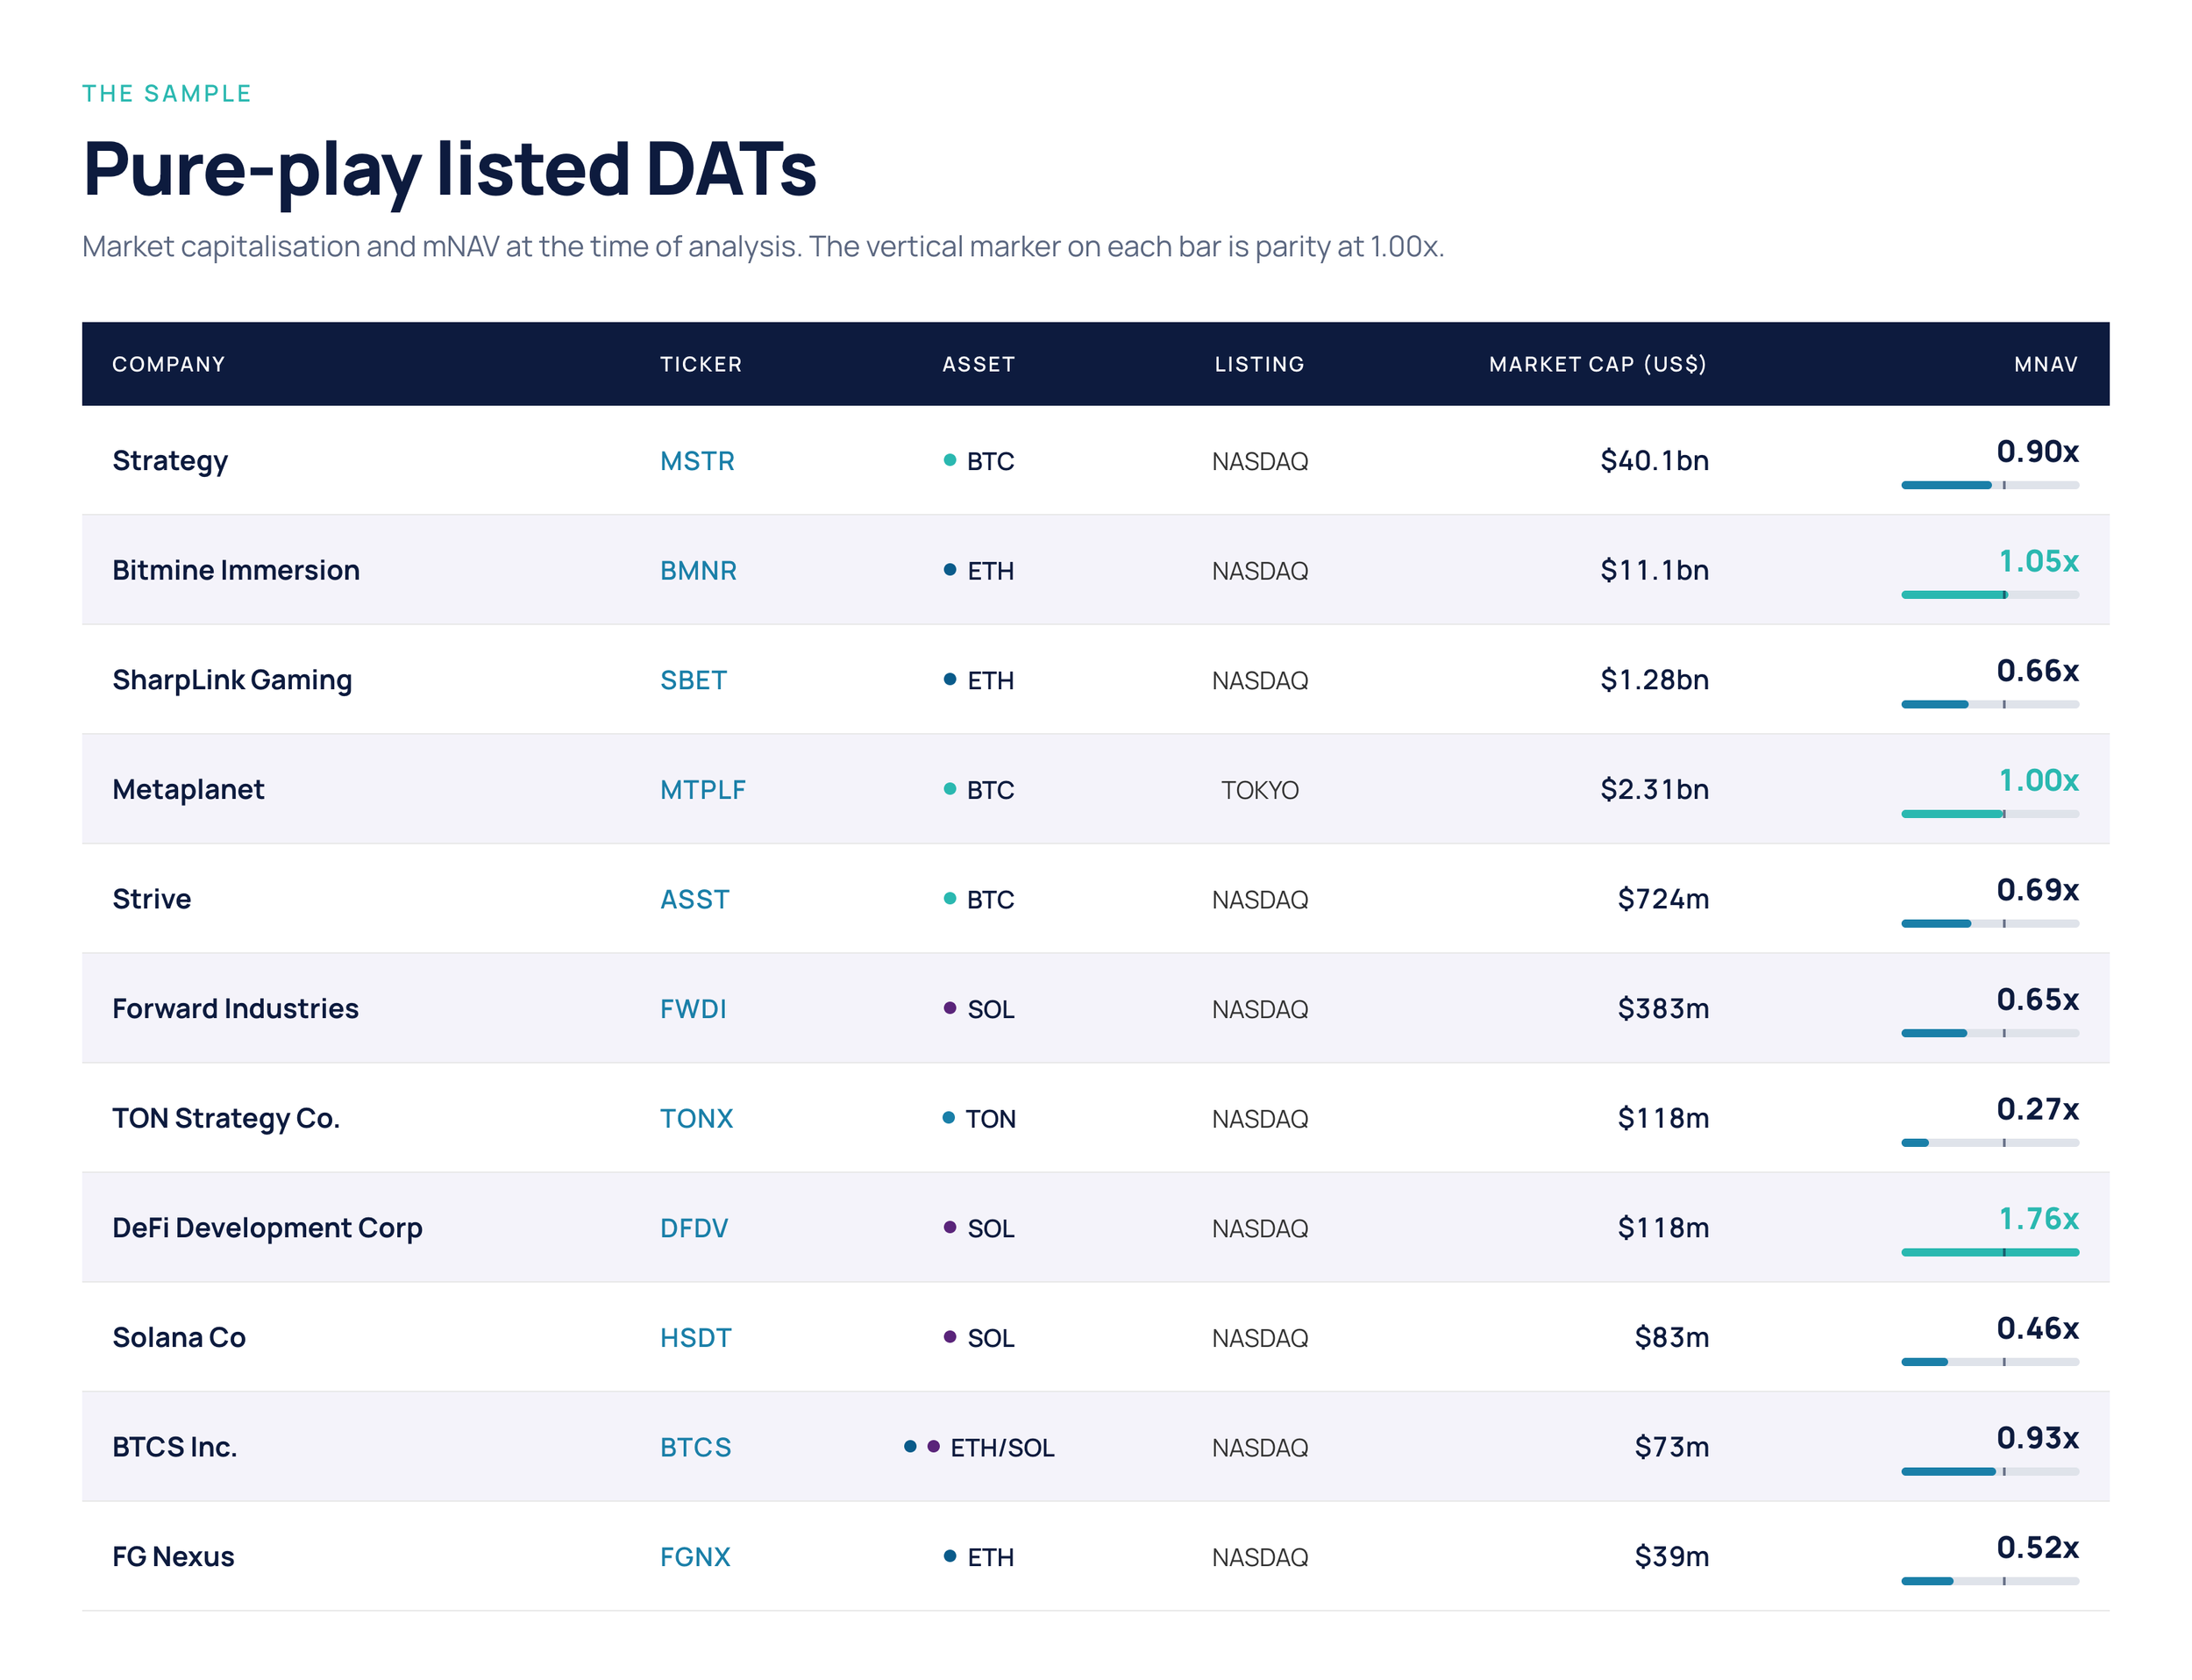
DATs holding similar digital asset can trade at very different mNAV multiples.
That raises the central question: if the underlying digital asset is only part of the story, what else is the market pricing? The research suggests the answer lies in the company around the asset.
Why the DAT flywheel matters
mNAV compares a company’s enterprise value with the market value of the digital assets it holds. An mNAV above 1.0x means the market is valuing the company at a premium to those holdings, while an mNAV below 1.0x indicates a discount.
For DATs, that premium can be more than a valuation outcome. It can become a strategic asset.
When a company trades above NAV, it may be able to raise capital on favourable terms and use that capital to acquire additional digital assets. If this increases digital assets per share, the process can become self-reinforcing: a stronger valuation supports further capital raising, which supports further asset accumulation.
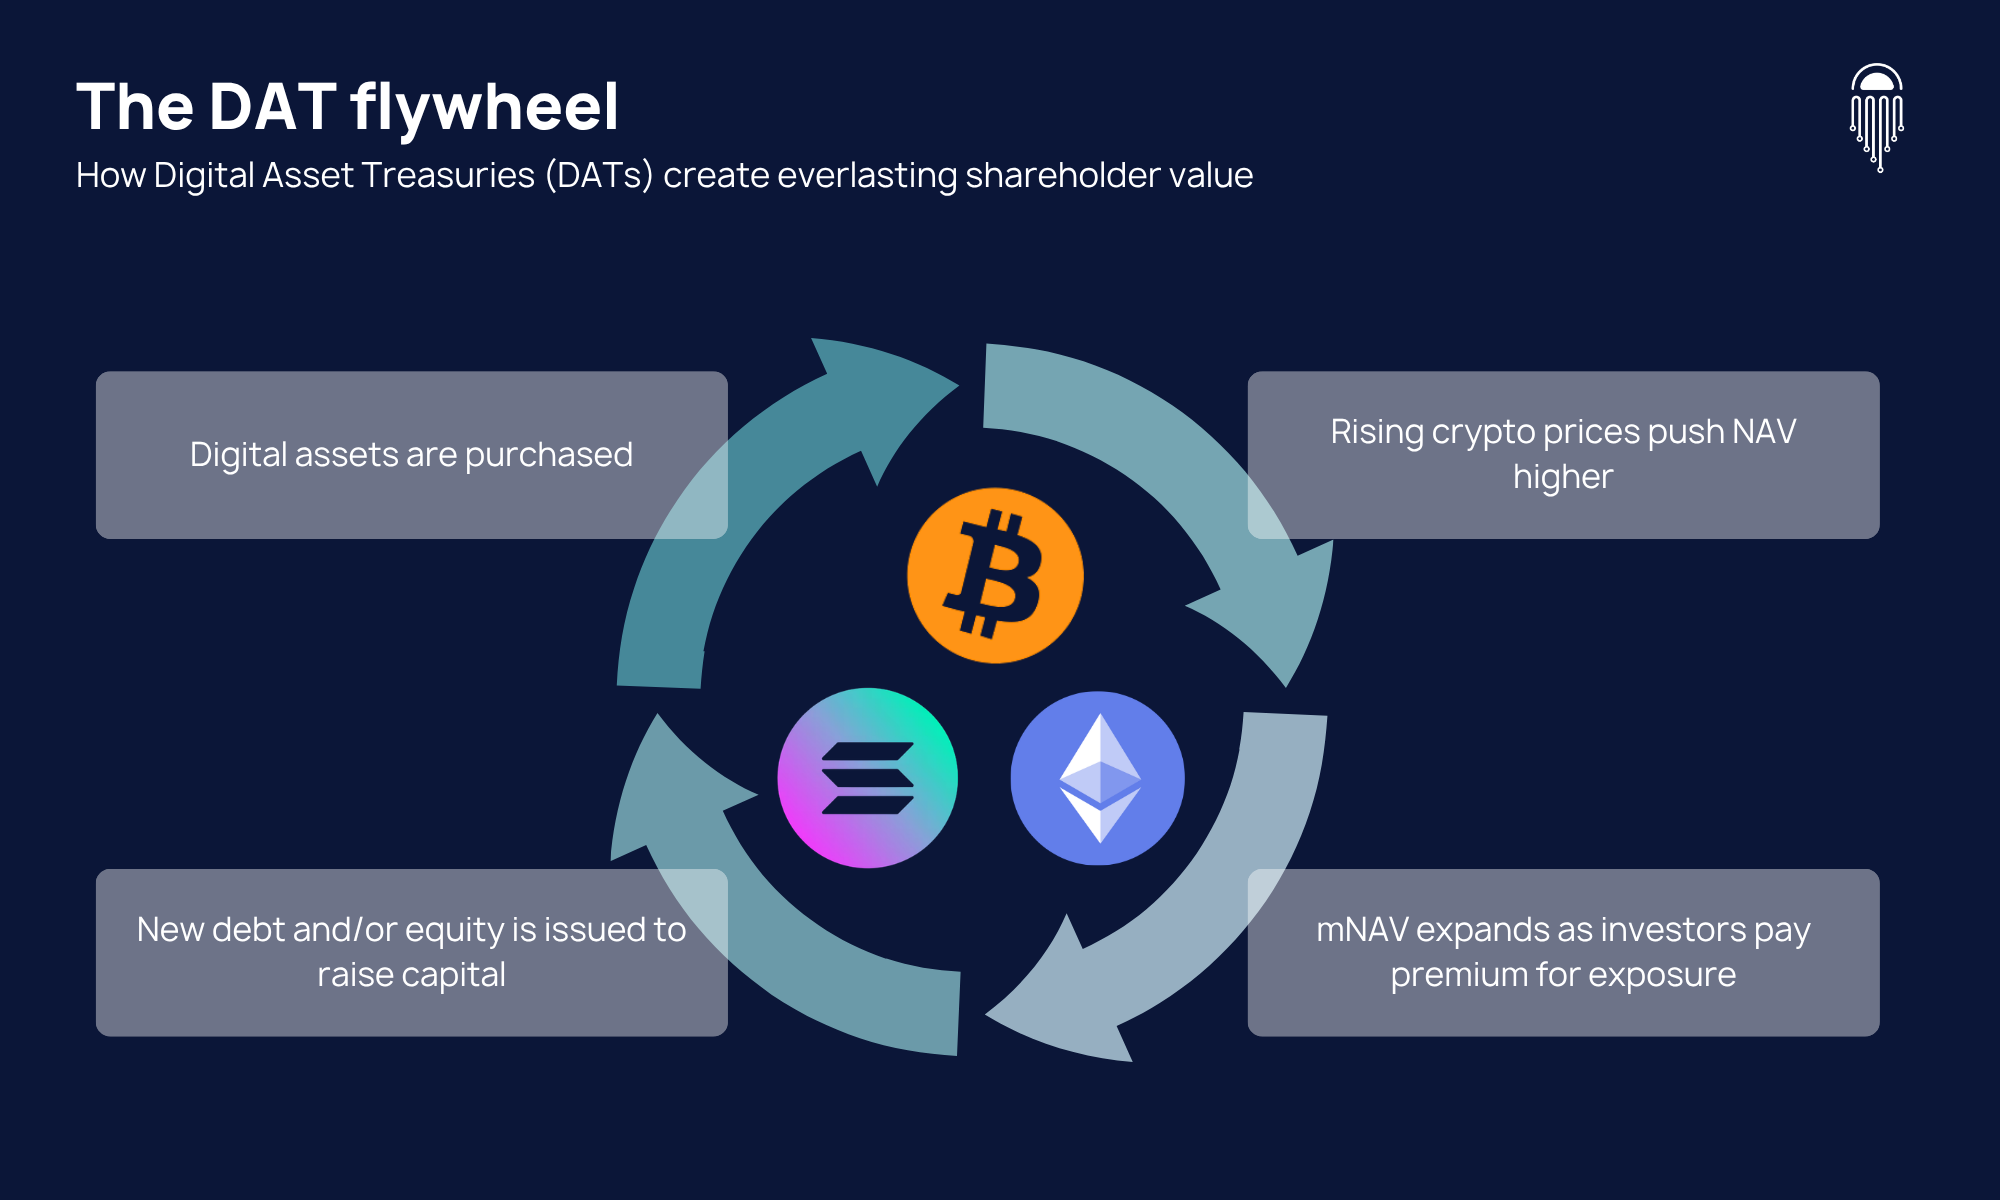
The DAT flywheel: premium valuations can create additional capital-raising capacity, supporting further asset accumulation.
If mNAV falls towards or below 1.0x, the same mechanism can work in reverse. New equity issuance may become dilutive, reducing existing shareholders’ exposure and making it harder to restart the flywheel. This is why mNAV alone does not tell the whole story. The ability to sustain a premium may depend heavily on the structure, credibility and capital discipline of the company itself.
What sits behind the valuation?
The research assessed DATs across five structural factors:
transparency and disclosure
shareholder composition
capital-raising mechanics
leverage and capital structure
asset type and treasury strategy.
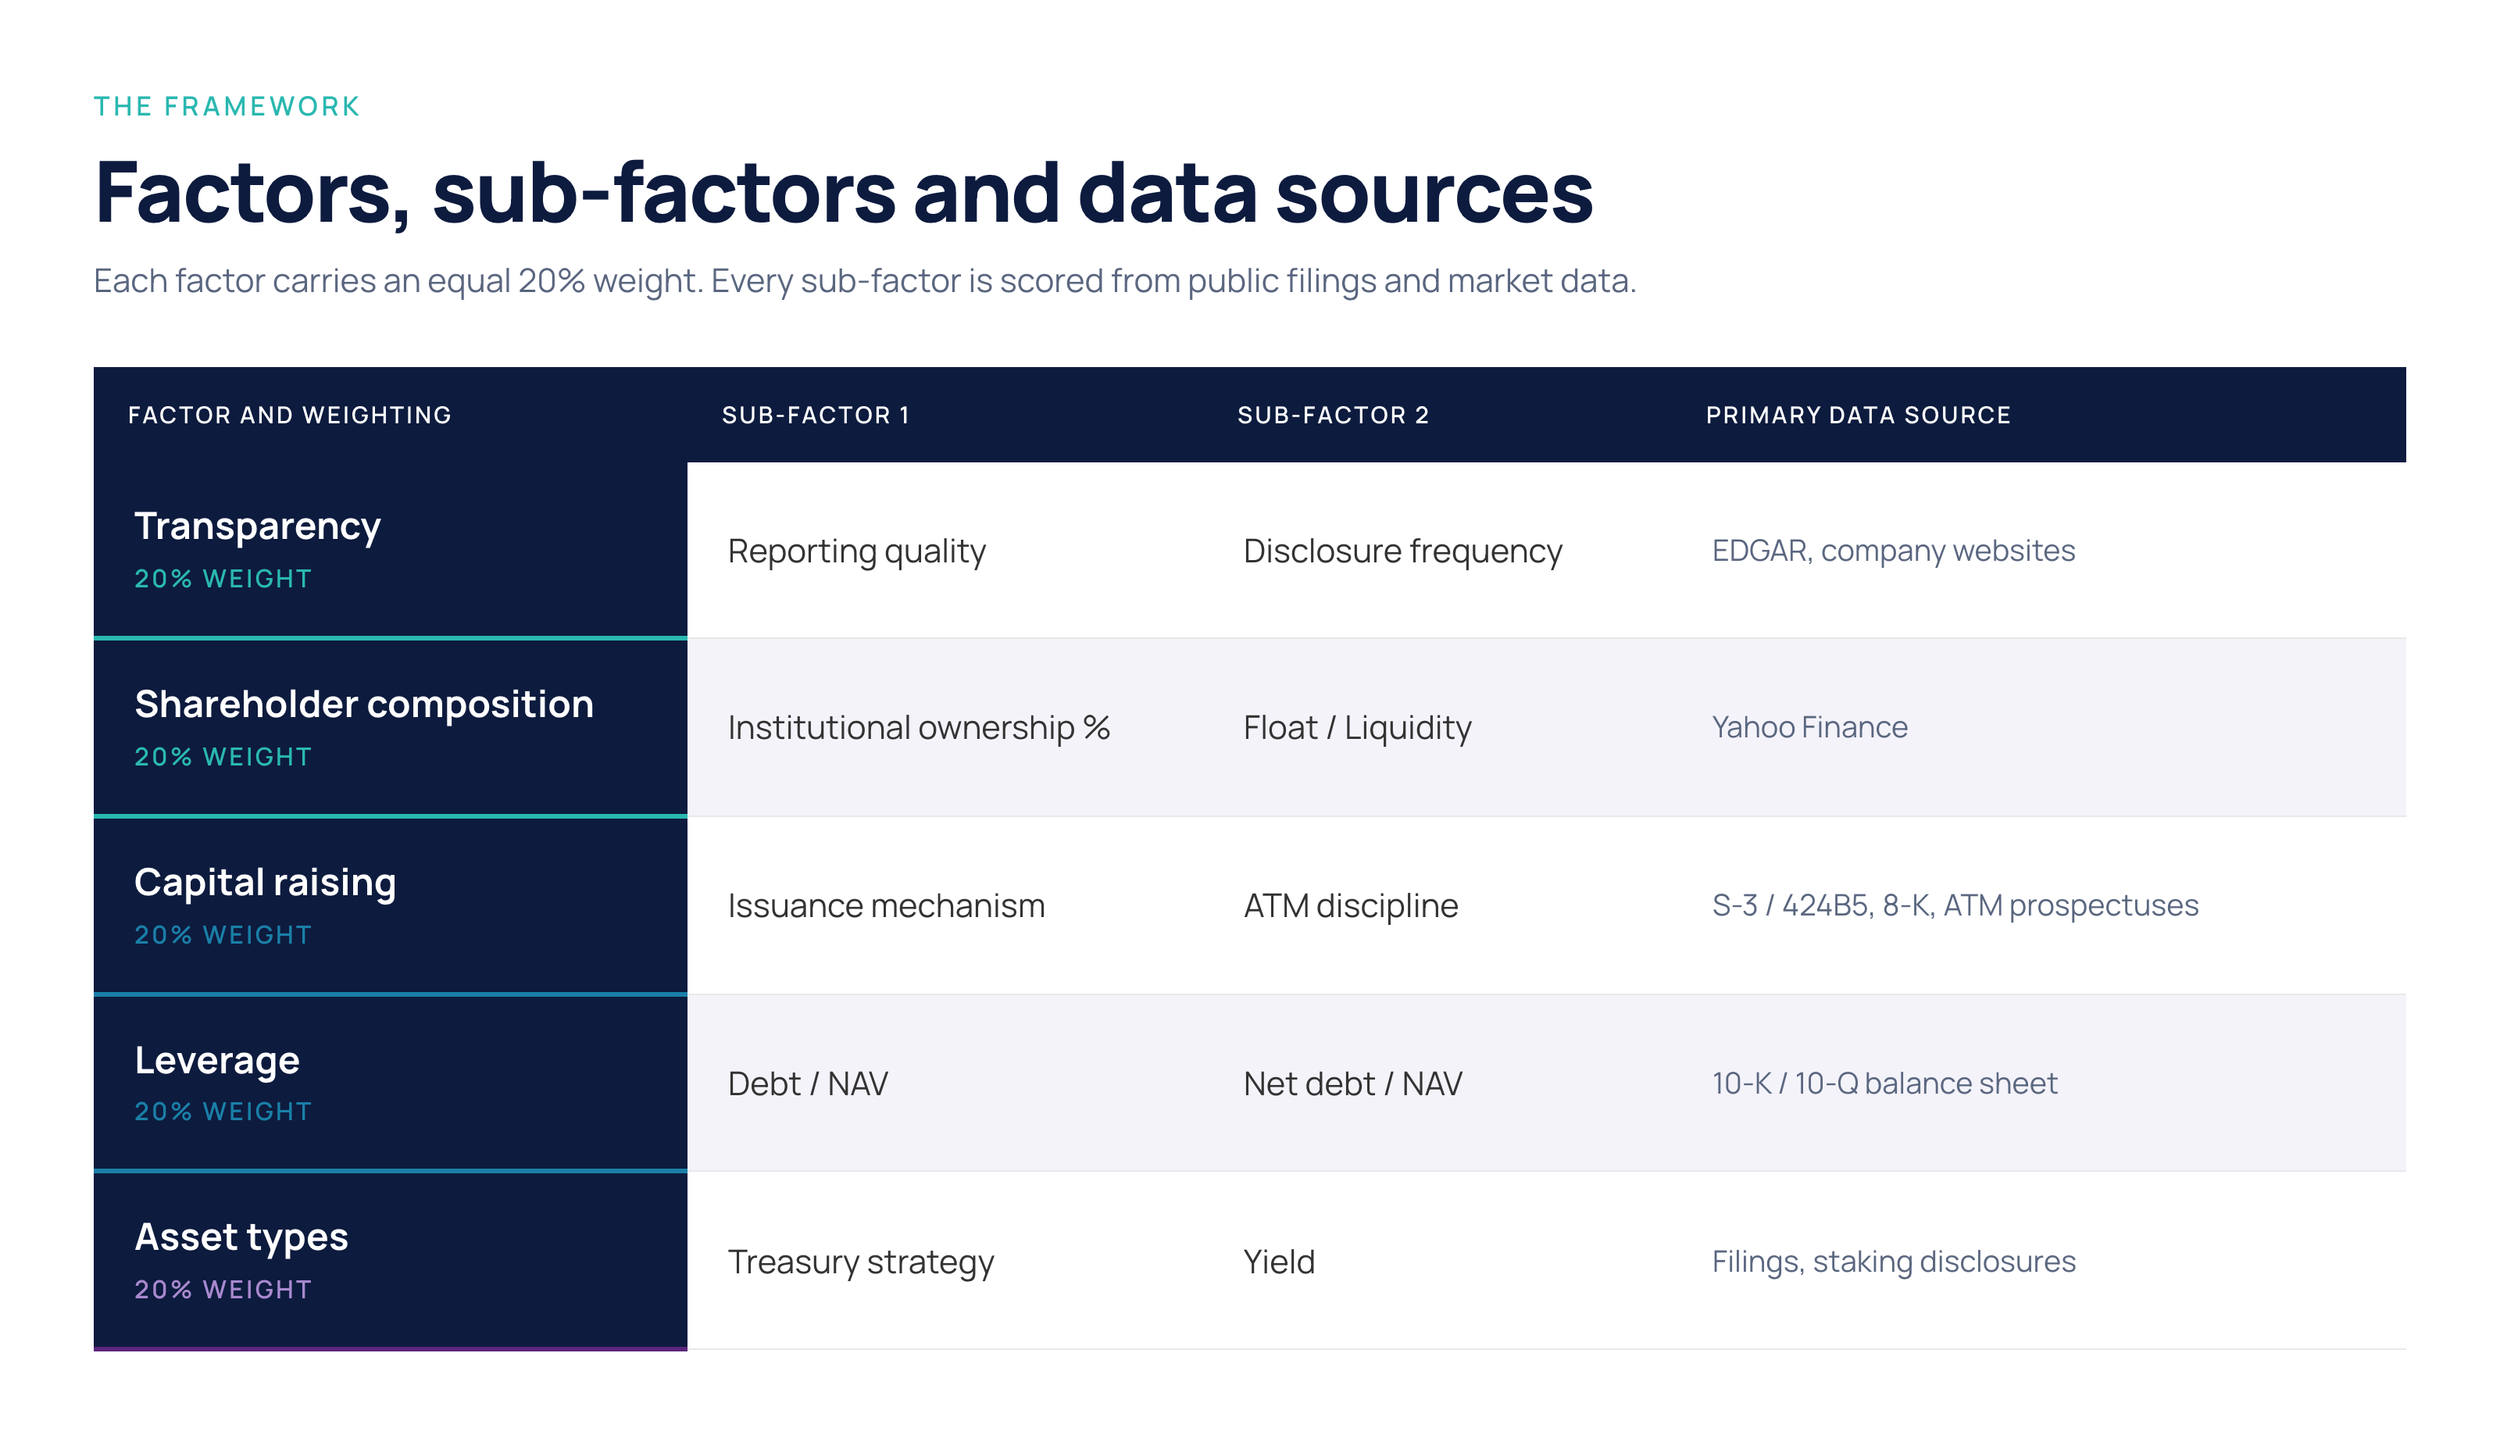
Each factor carries an equal 20% weight, with individual sub-factors scored using public filings and market data.
Together, these factors ask some practical questions. Can investors clearly see what the company owns and how those holdings are changing? Can institutions access the stock? Can management raise capital without destroying shareholder value? Is the balance sheet resilient through market downturns? And is the treasury strategy clear and productive?
The underlying idea is simple: two companies can hold the same digital asset but produce very different outcomes for shareholders.
How the companies were scored
Each DAT was scored from one to five across ten underlying sub-factors, which were then equally weighted into a composite structural score.
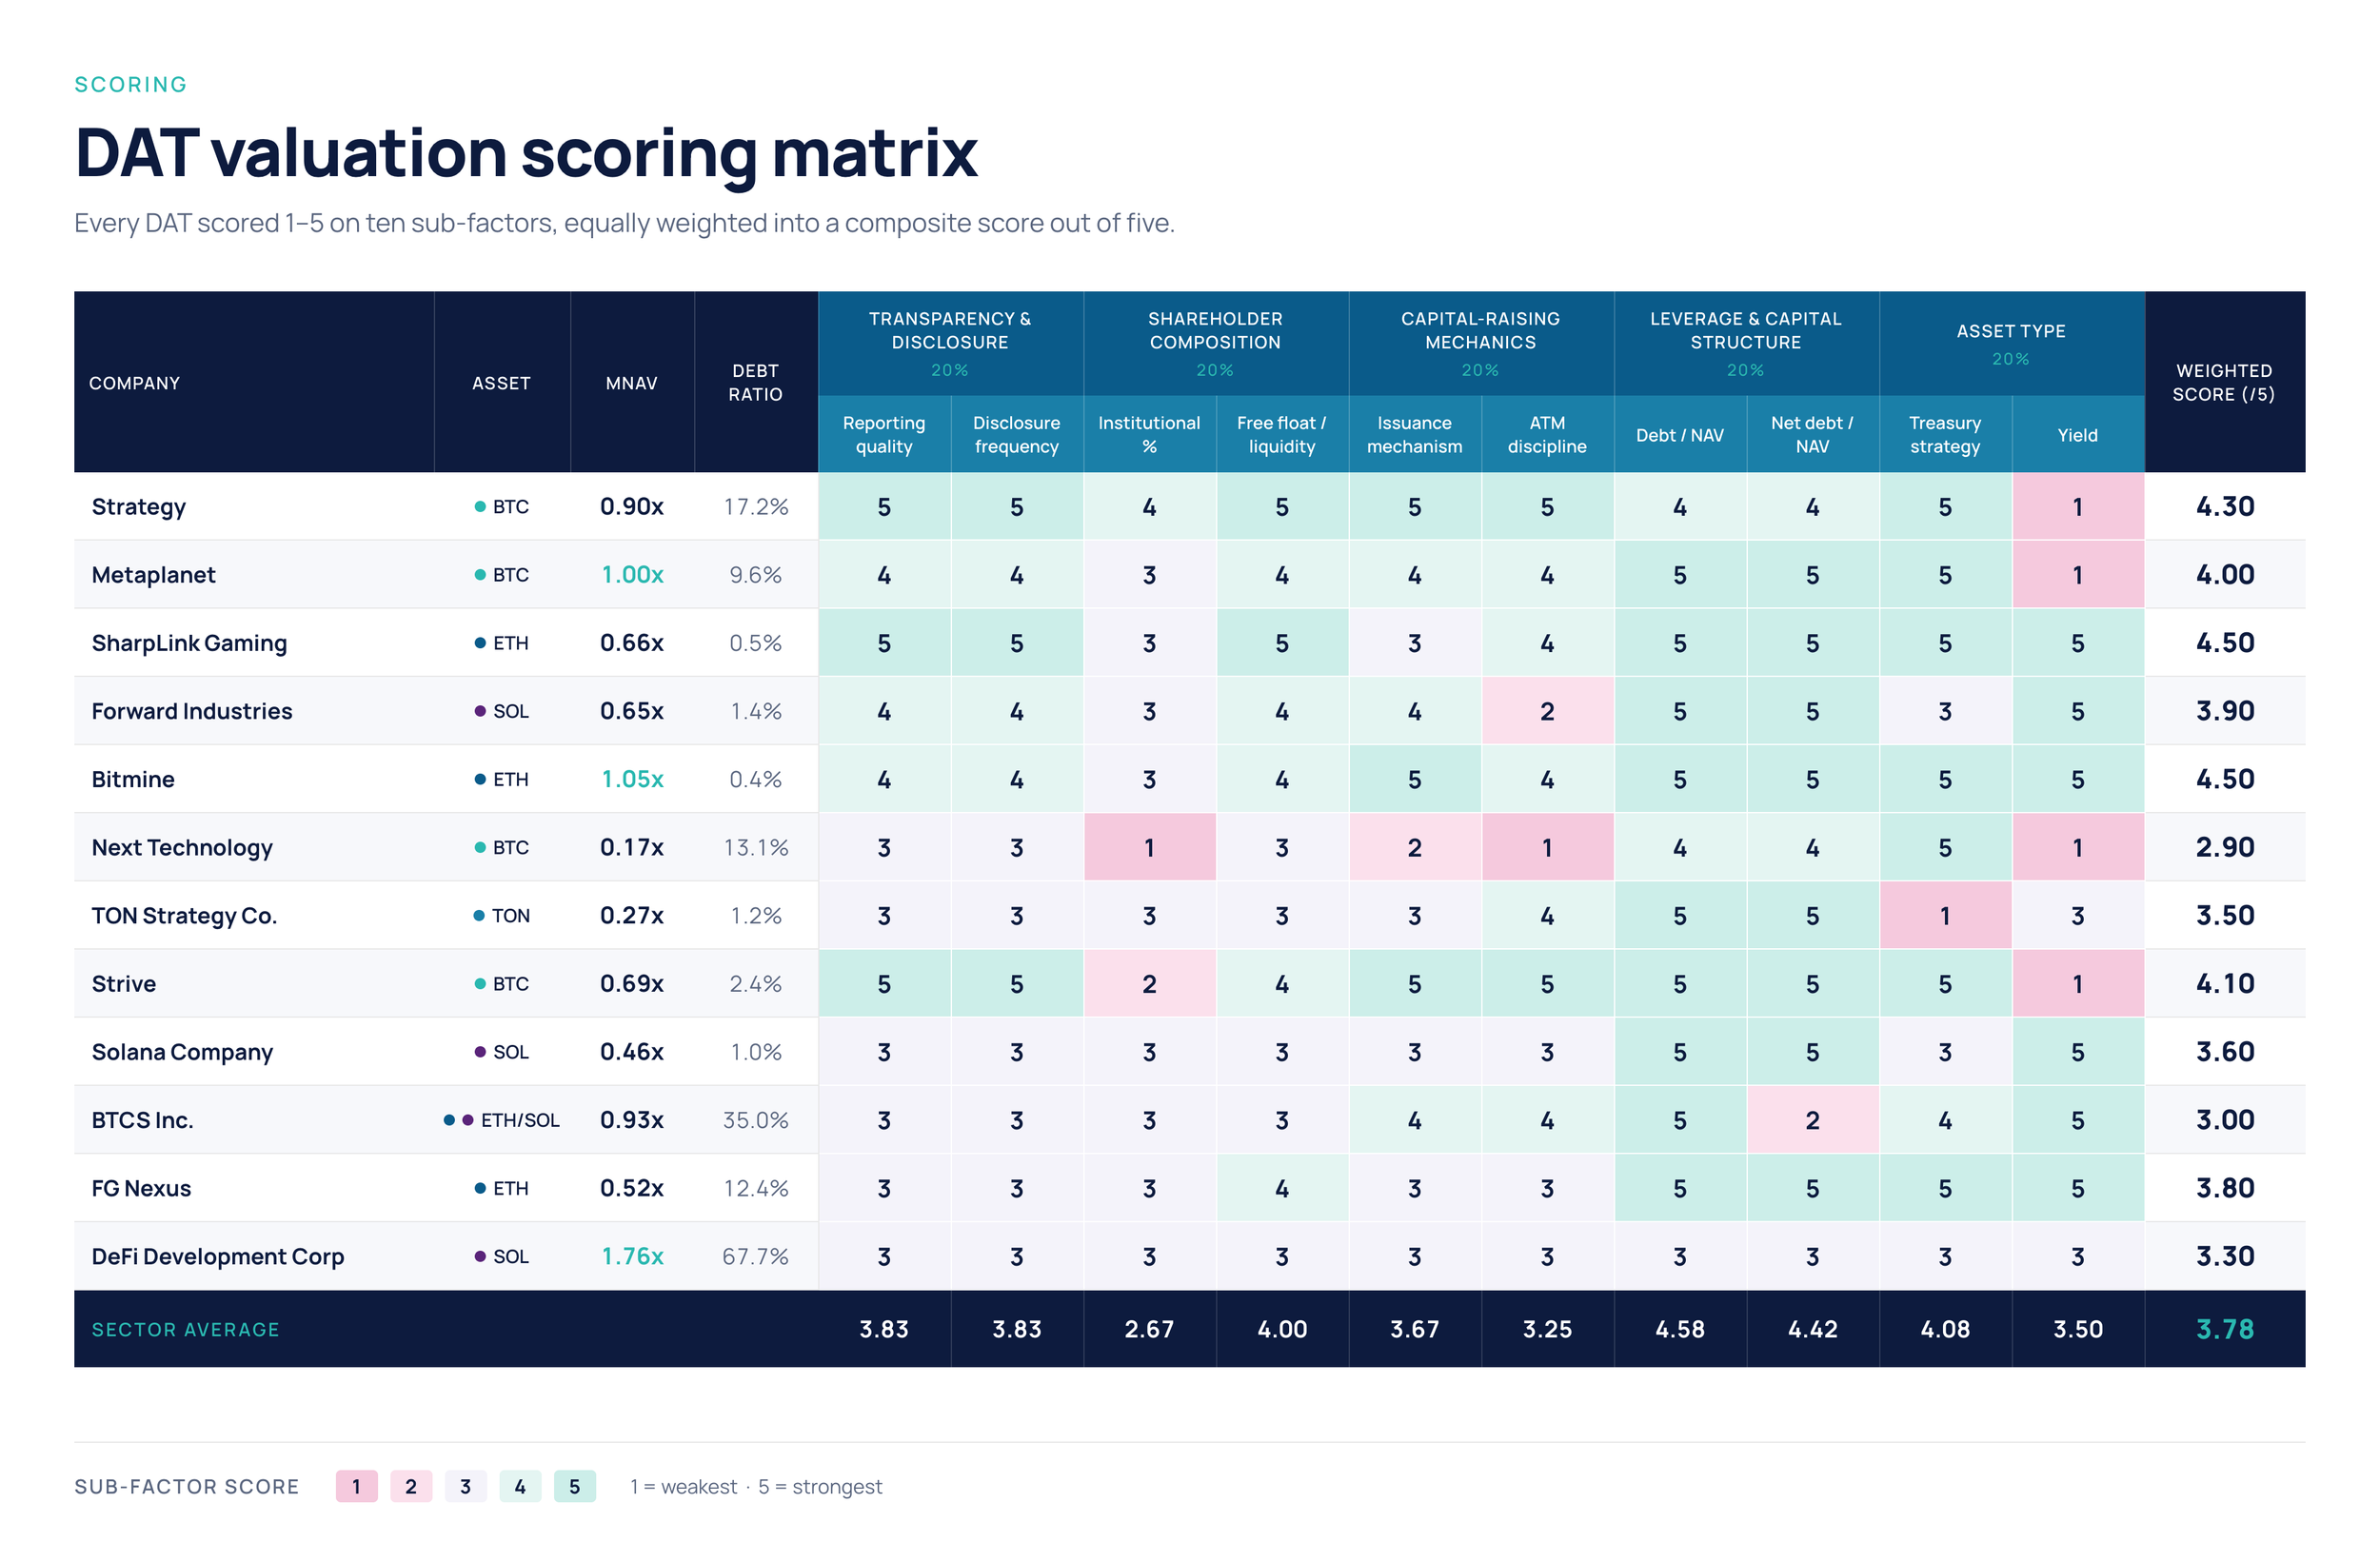
The full scoring matrix shows how each company scores across the ten sub-factors.
Does structural quality show up in valuation?
To test the framework, the research compared each DAT’s composite structural score with its observed mNAV. Across the full sample, the picture was mixed, with several statistical outliers.
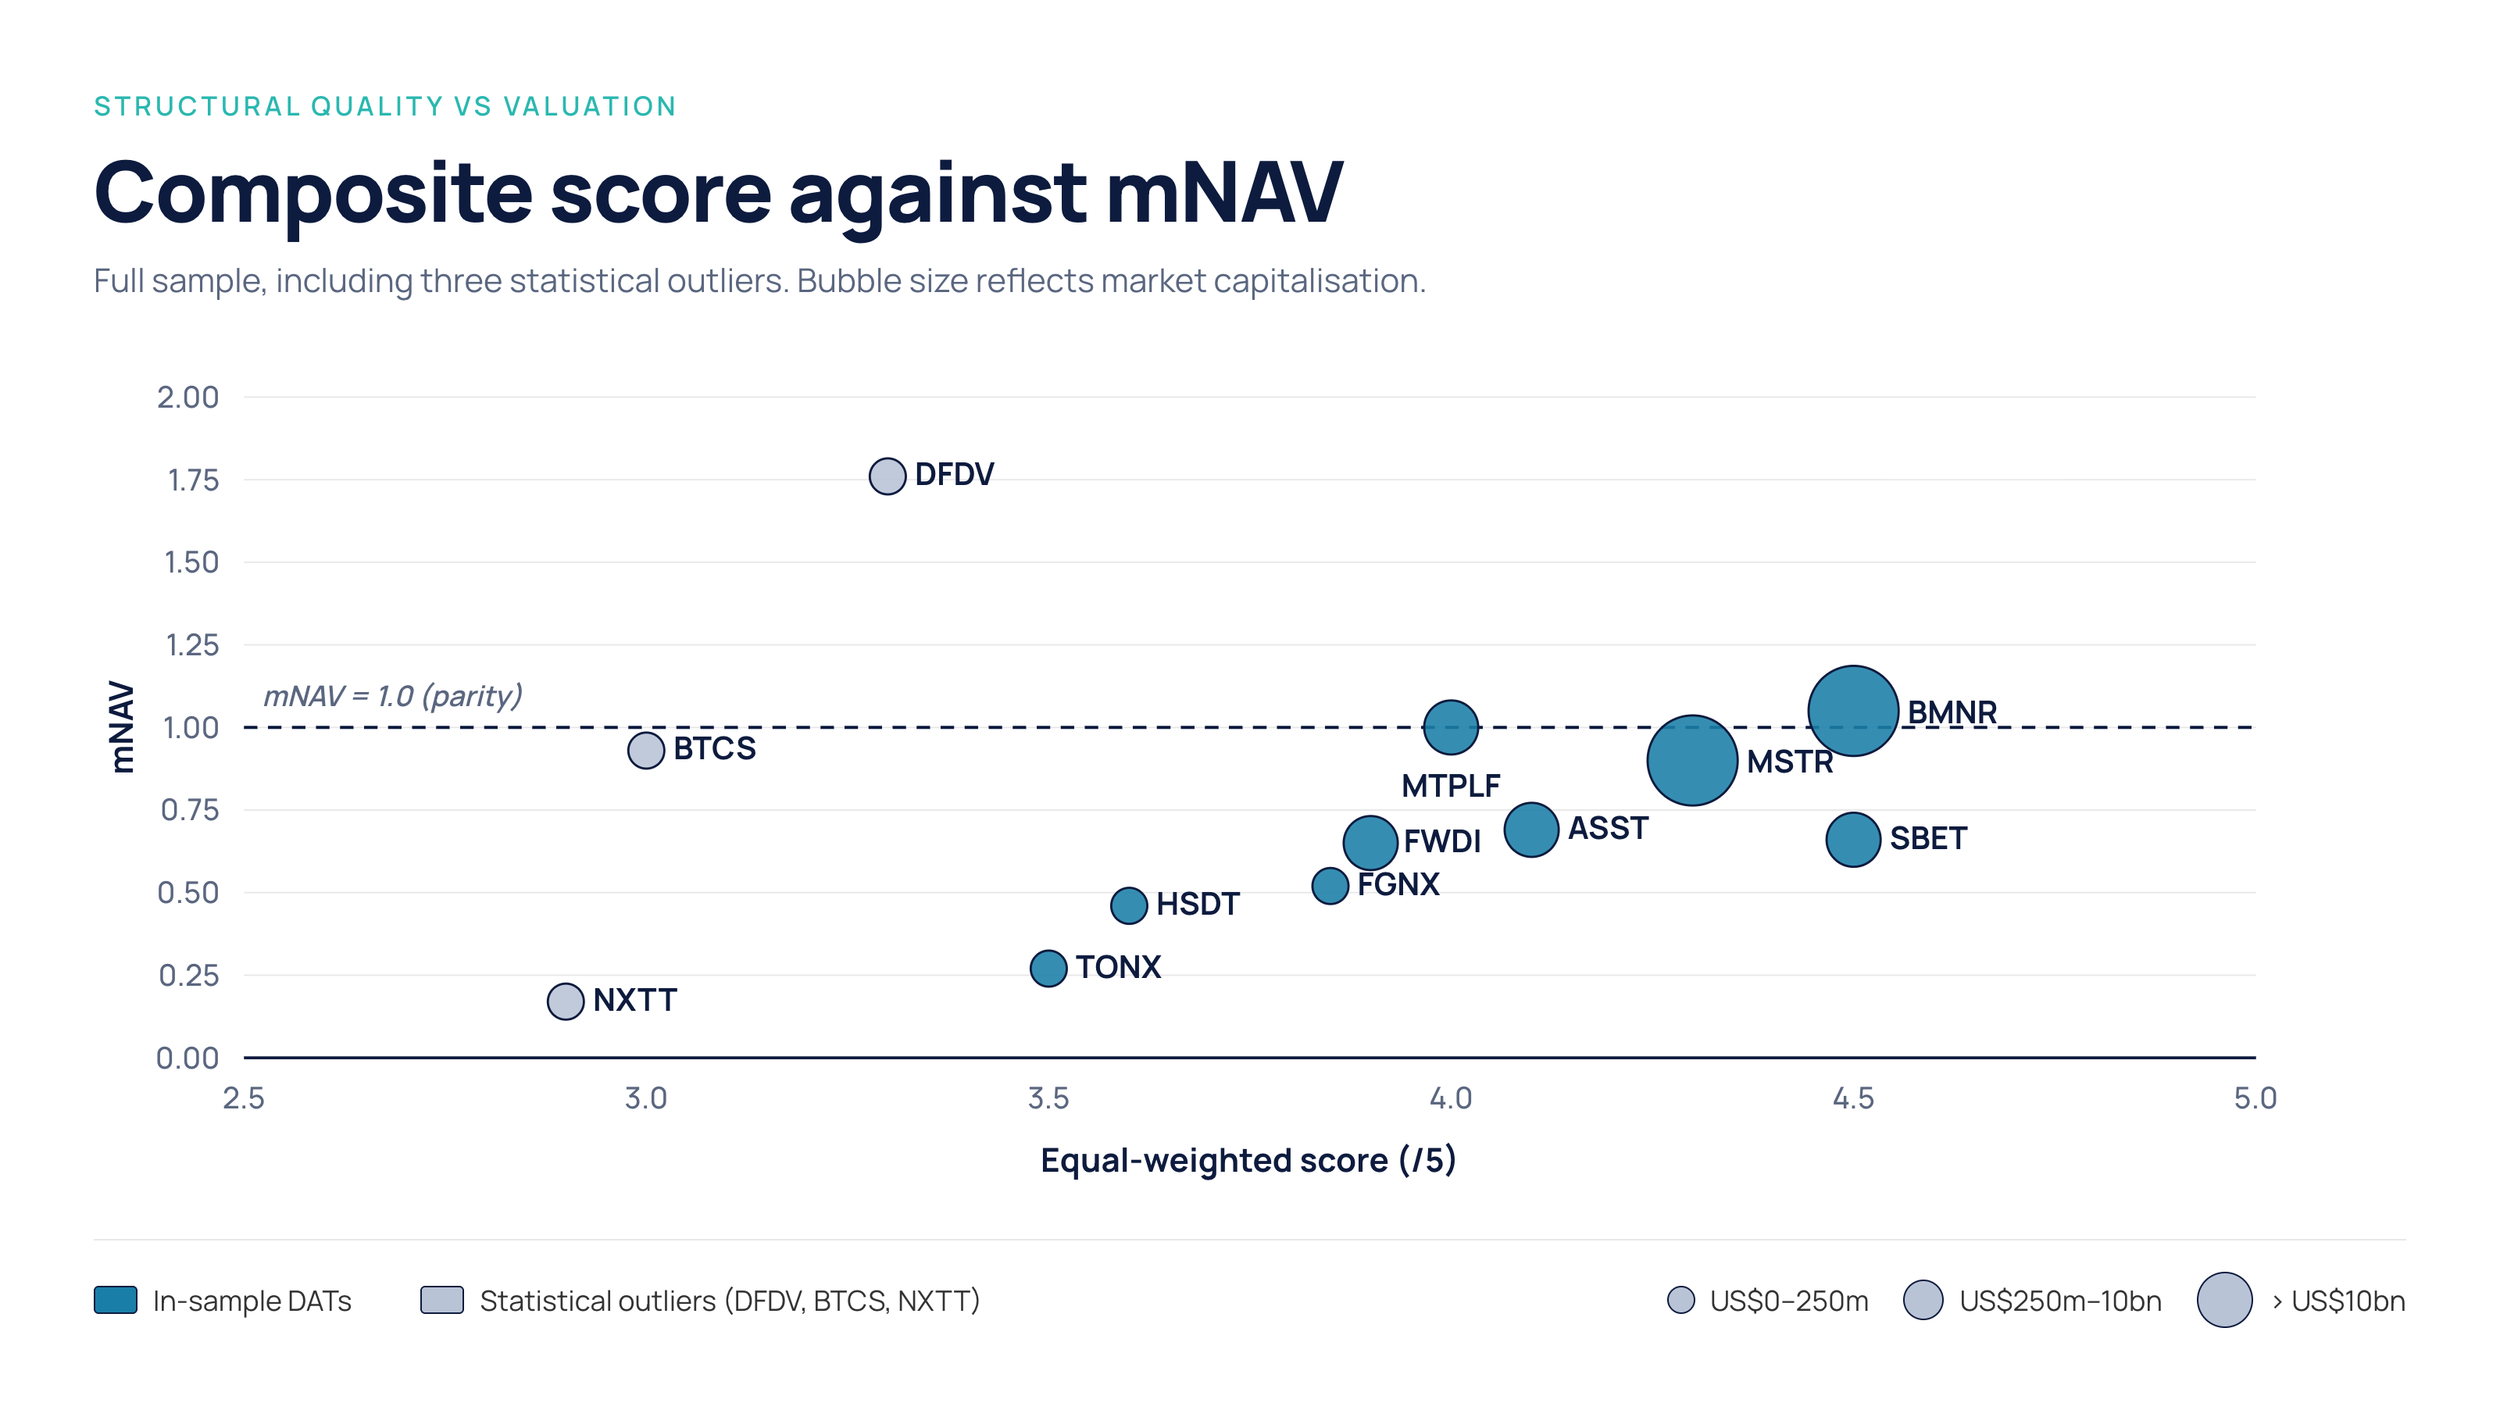
But when the analysis was narrowed to pure-play Bitcoin and Ethereum DATs, the relationship became considerably clearer.
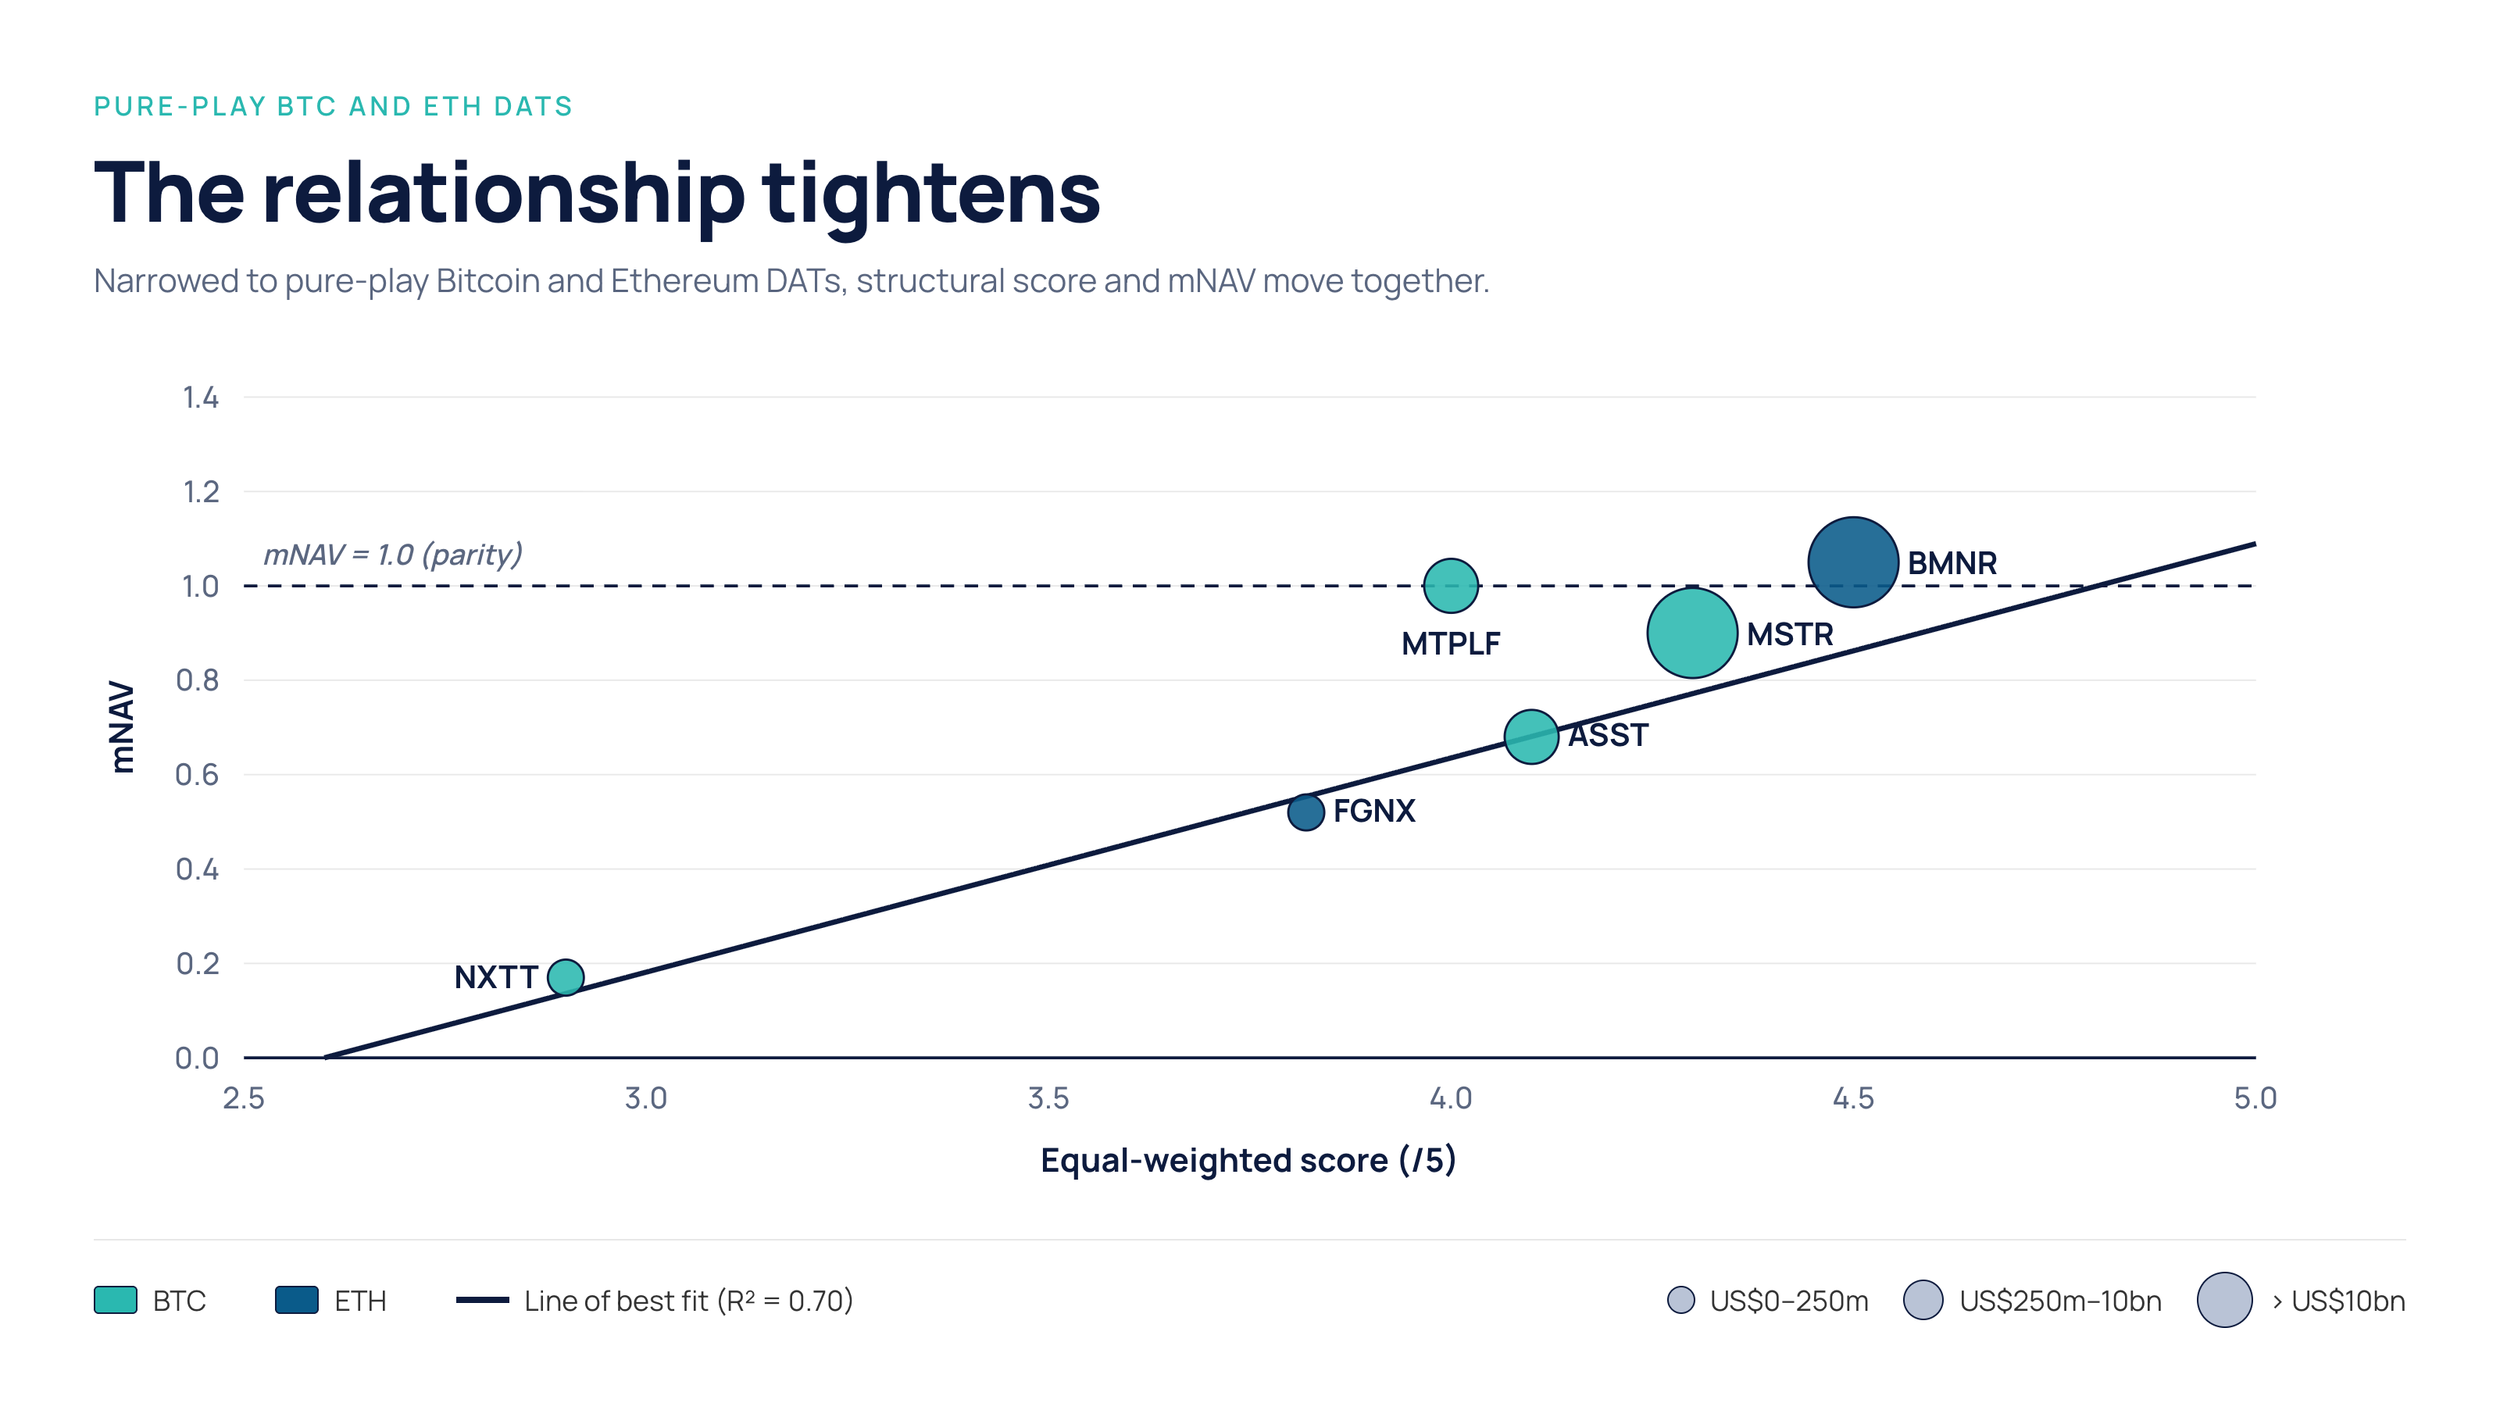
Among pure-play Bitcoin and Ethereum DATs, higher structural scores tended to coincide with higher mNAV multiples.
Within this group, the composite structural score and mNAV showed a correlation coefficient of 0.70, with higher-scoring DATs tending to trade at higher mNAV multiples.The sample is small and the sector remains young, so the result should be interpreted cautiously. It does, however, provide evidence that the market may differentiate between DATs based on more than simply the value of the assets they hold.
Fundamentals move slowly. Markets move quickly.
Perhaps the more interesting finding comes from looking at these companies through time. The structural characteristics measured by the framework tend to evolve gradually. Disclosure practices, institutional ownership, financing capability, leverage and treasury strategy usually change over quarters rather than days.
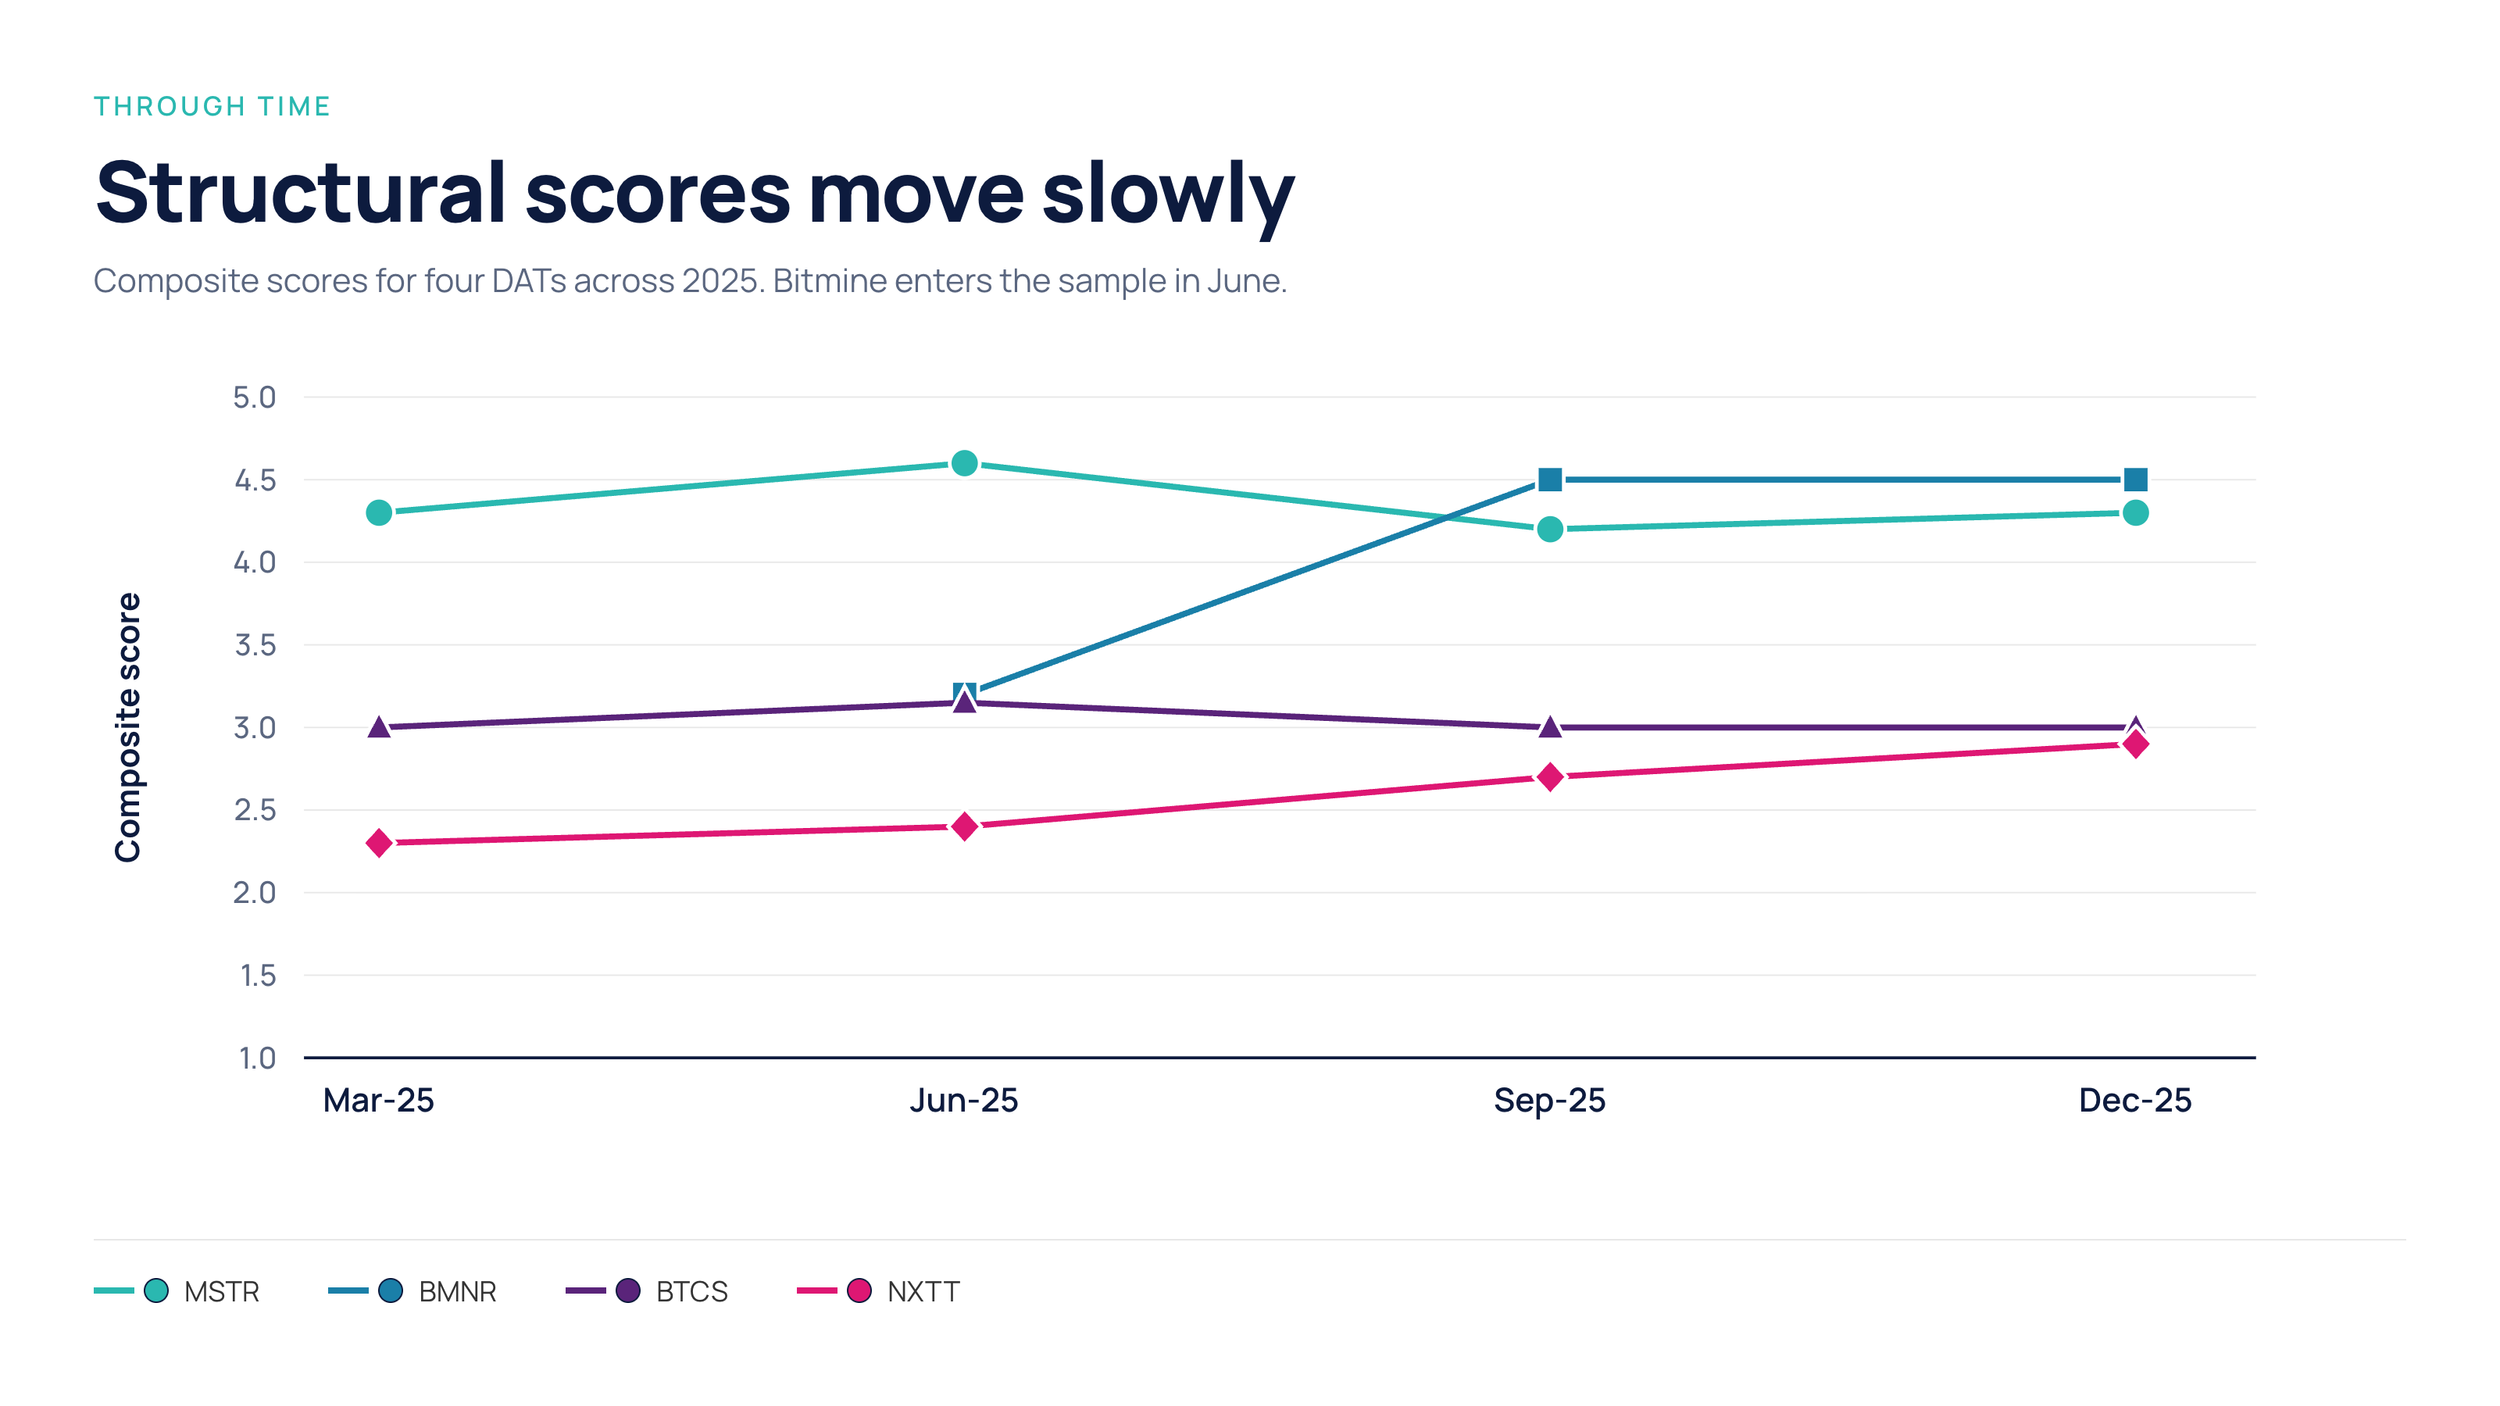
Composite structural scores tend to change gradually as company fundamentals evolve.
The company around the asset matters
mNAV can move much faster. It responds to digital asset prices, broader market sentiment, investor flows and company-specific events. During the second half of 2025, the research observed periods when structural scores improved while mNAV multiples fell.
This creates the potential for valuation and structural quality to diverge. A DAT can become cheaper without necessarily becoming structurally weaker. Equally, a higher valuation does not automatically mean the underlying company has improved. And a discount to NAV is not automatically an opportunity. If that discount reflects weak disclosure, poor capital allocation, excessive leverage or other structural weaknesses, the market may already be pricing in genuine risk.
For investors, the more useful question is therefore not simply whether a DAT trades at a premium or discount. It is whether that valuation is justified by the structure underneath it.
If you would like the full copy of the original research paper, Exploring Digital Asset Treasury Valuations, authored by Roshan De Zoysa, please email us at sales@jellyc.io